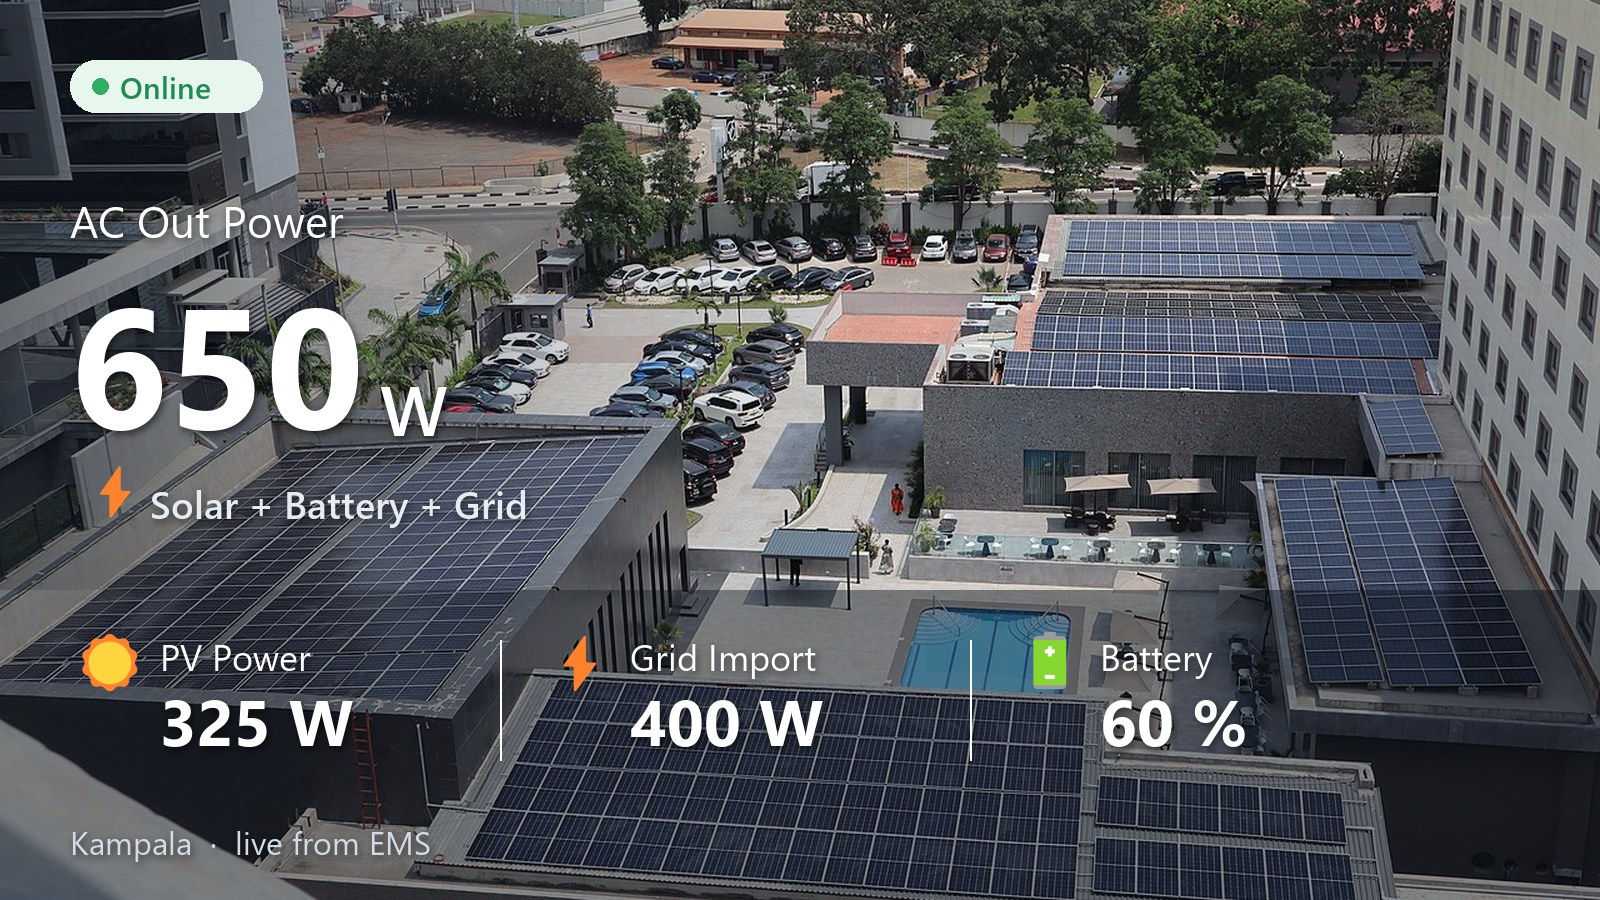
1Real-time monitoring
Every power path, live
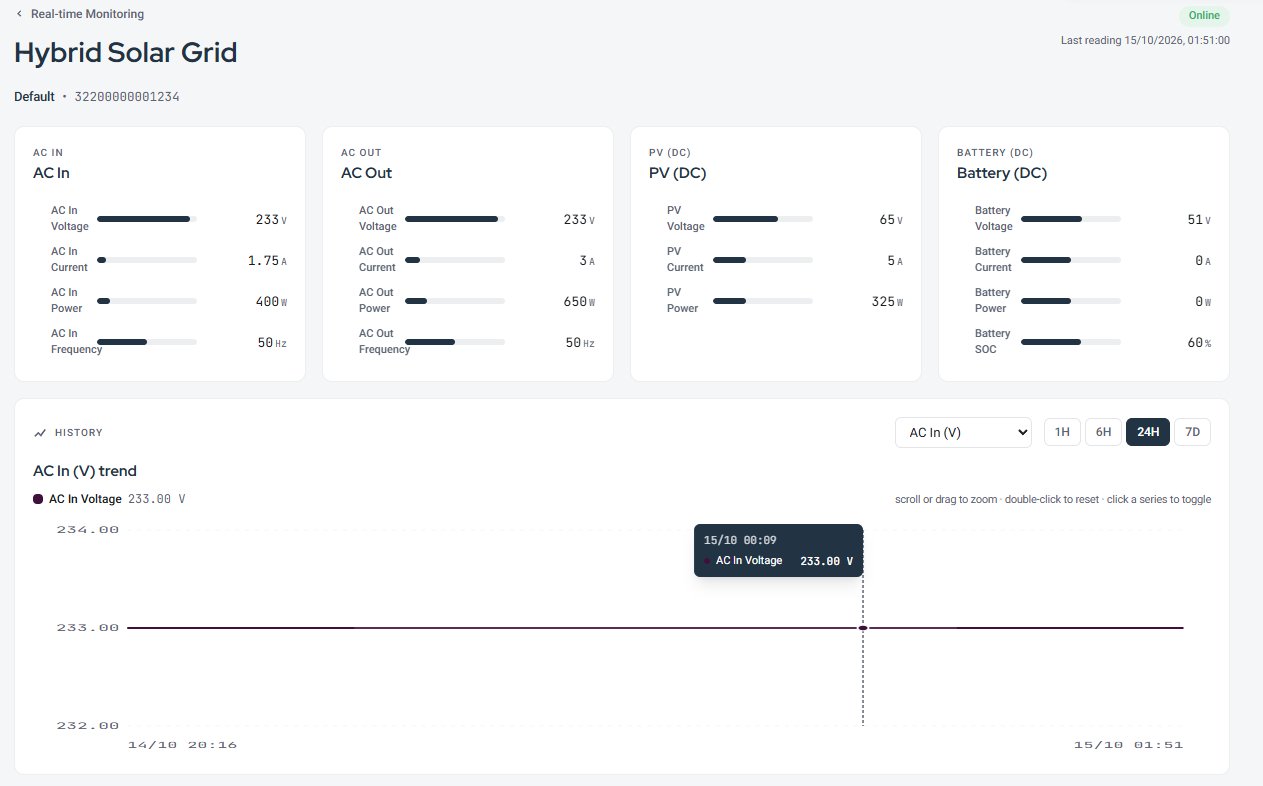
The site's live page shows one card per power path. Each path has its own colour, used on the cards and in the history chart alike.
- Grid (AC In): voltage, current, power and frequency, so outages and poor supply show at once
- Load (AC Out): what the site is actually consuming
- Solar (PV): voltage, current and power produced
- Battery: voltage, current, power and state of charge
- History over 1 hour, 6 hours, 24 hours or 7 days, with zoom
2Typology
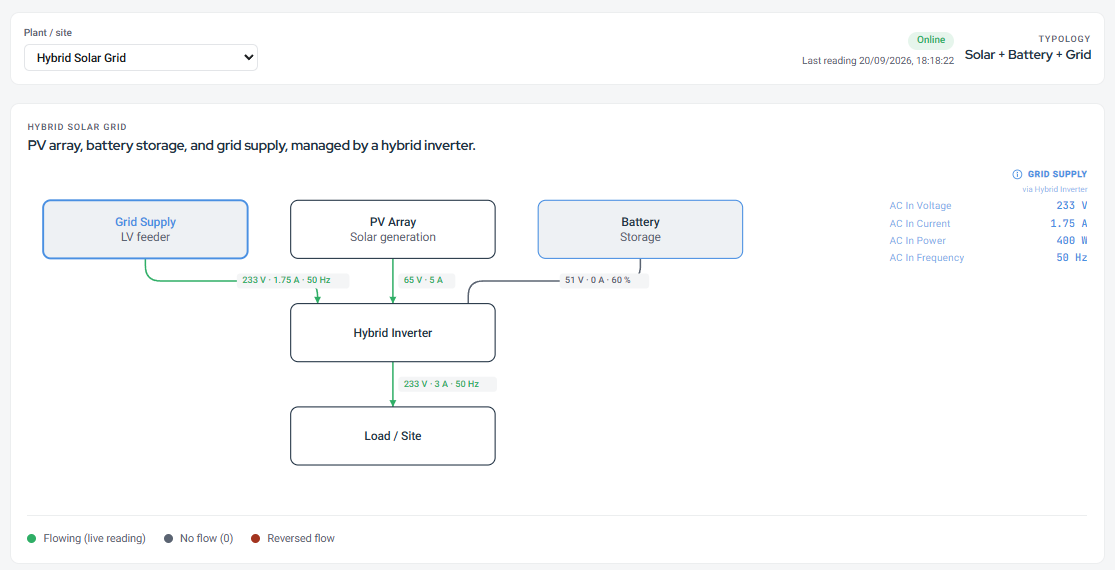
The site drawn as it is wired
EMS draws the site as a live single-line diagram: grid, solar array and battery feeding the hybrid inverter, and the inverter feeding the load. Each connection carries its live values.
- Green: power flowing. Grey: no flow. Red: reversed flow
- Click any block to see its live readings
- Ready-made layouts for common setups, chosen per site
3App view
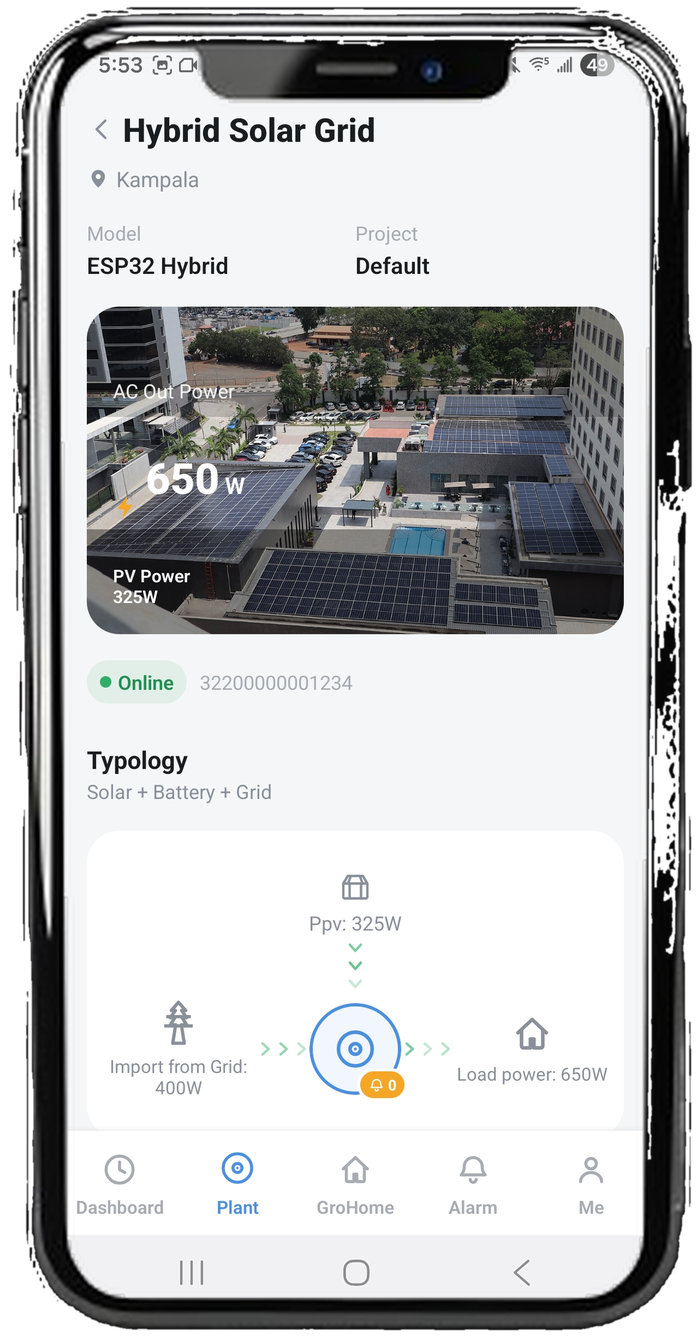
The whole site in your pocket
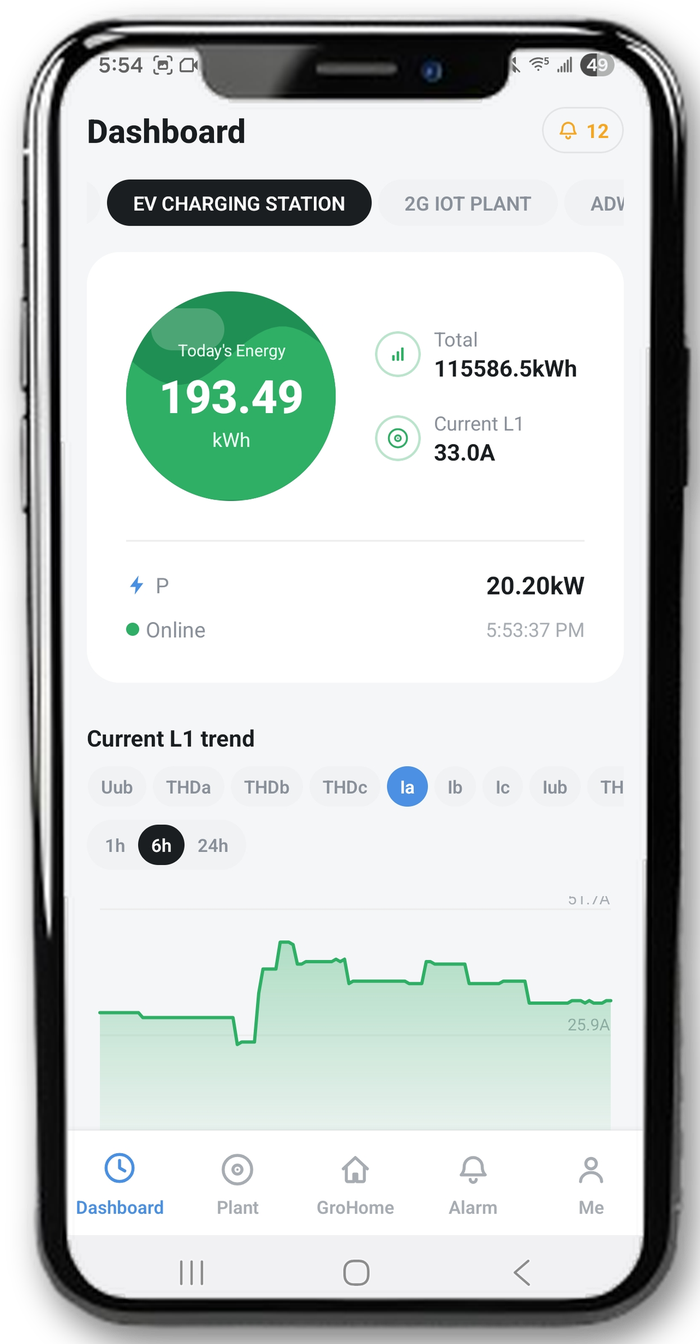
The mobile app shows the same site: solar production, grid import and load power, with arrows showing which way power is flowing.
- Site view with live solar, grid and load power
- Daily energy and trend charts
- Online status and the time of the last reading
4Alerts
Know the moment something goes wrong
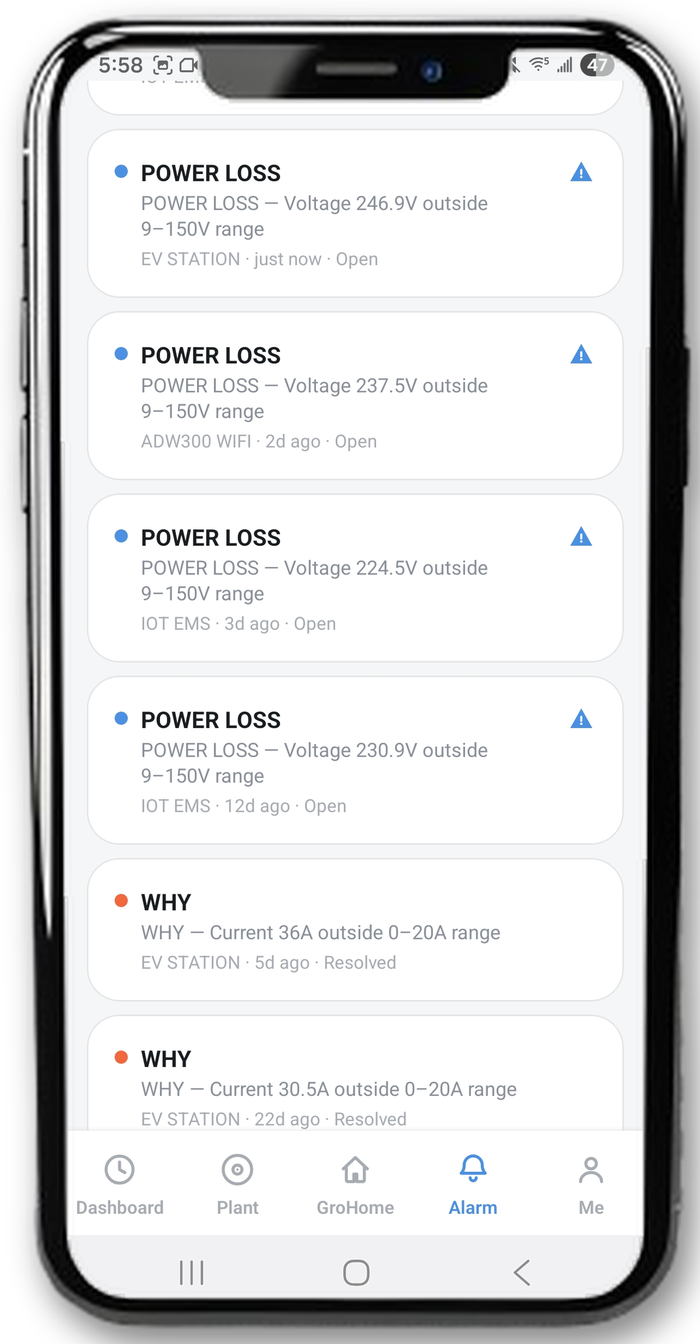
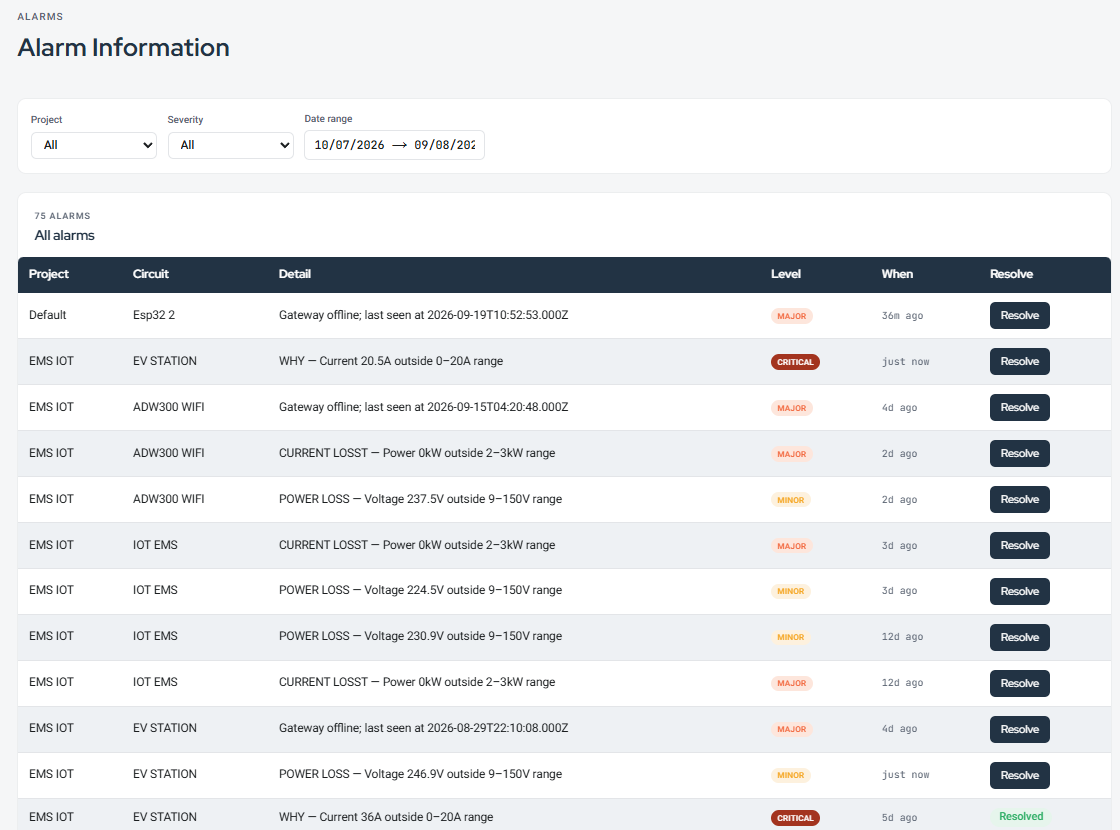
EMS raises an alert when a reading leaves the range set for it, or when a site stops reporting. Alerts appear on the web and on the phone.
- Three severities: minor, major and critical
- Grid outage, low battery, low solar output, site offline
- Every alert logged with its site, detail and time, then resolved
And there's more
Also included with EMS
Energy and cost reports
Daily energy and cost in UGX, as PDF on demand or on a schedule.
Carbon tracking
CO₂ linked to grid consumption, for sustainability reporting.
All sites, one dashboard
Status, alerts and energy across every site, on a map.
Remote switching
Switch outputs on supported smart meters from the web.
Prepaid management
Balances, recharges and low-balance alerts.
Team access
Admins, operators and read-only viewers, each with the right rights.
GSM or Wi-Fi
Gateways report over MTN/Airtel mobile data or Wi-Fi.
No rewiring
The gateway reads the inverter's communication port only.