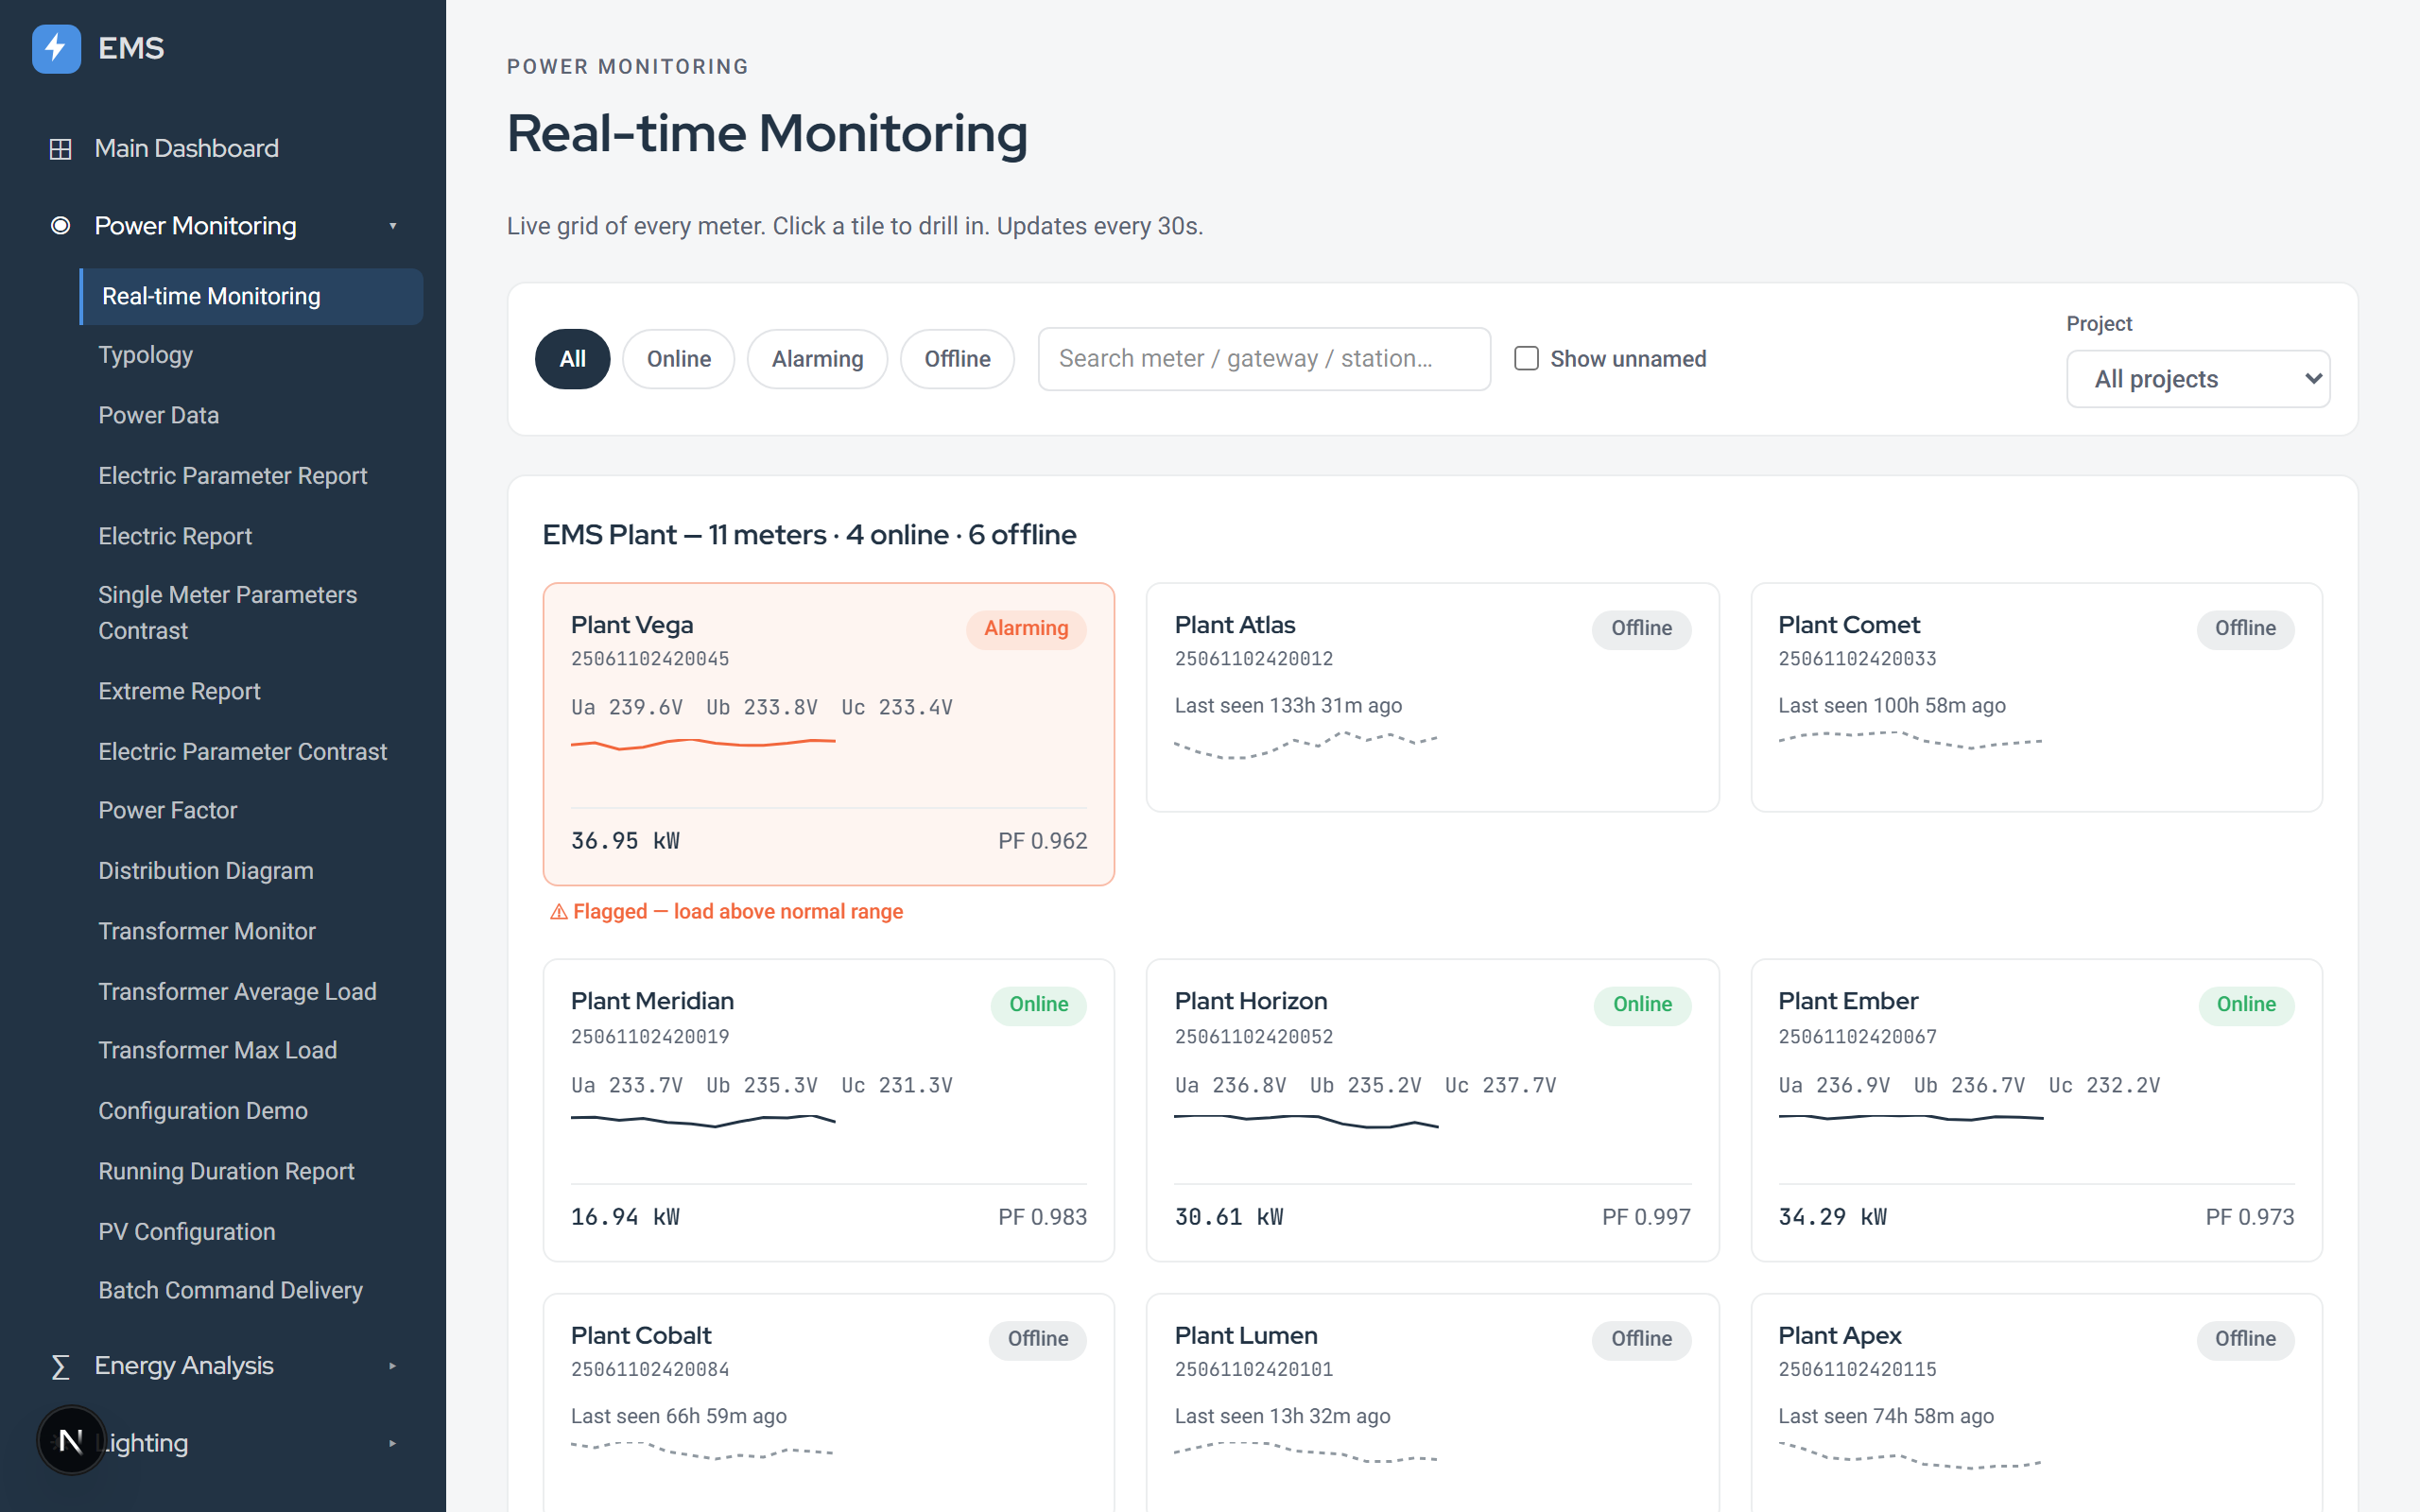
Plant monitoring
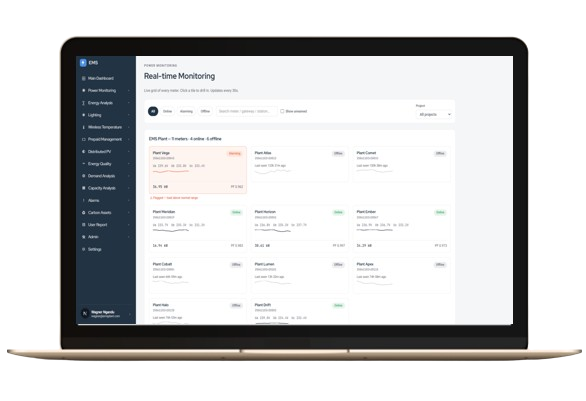
See every connected site in one live grid — power, voltage, and quality metrics that refresh every 30 seconds, with alarming tiles flagged the moment a meter drifts out of range.
- Real-time meter grid
- Per-plant power factor & load
- Search and filter by project
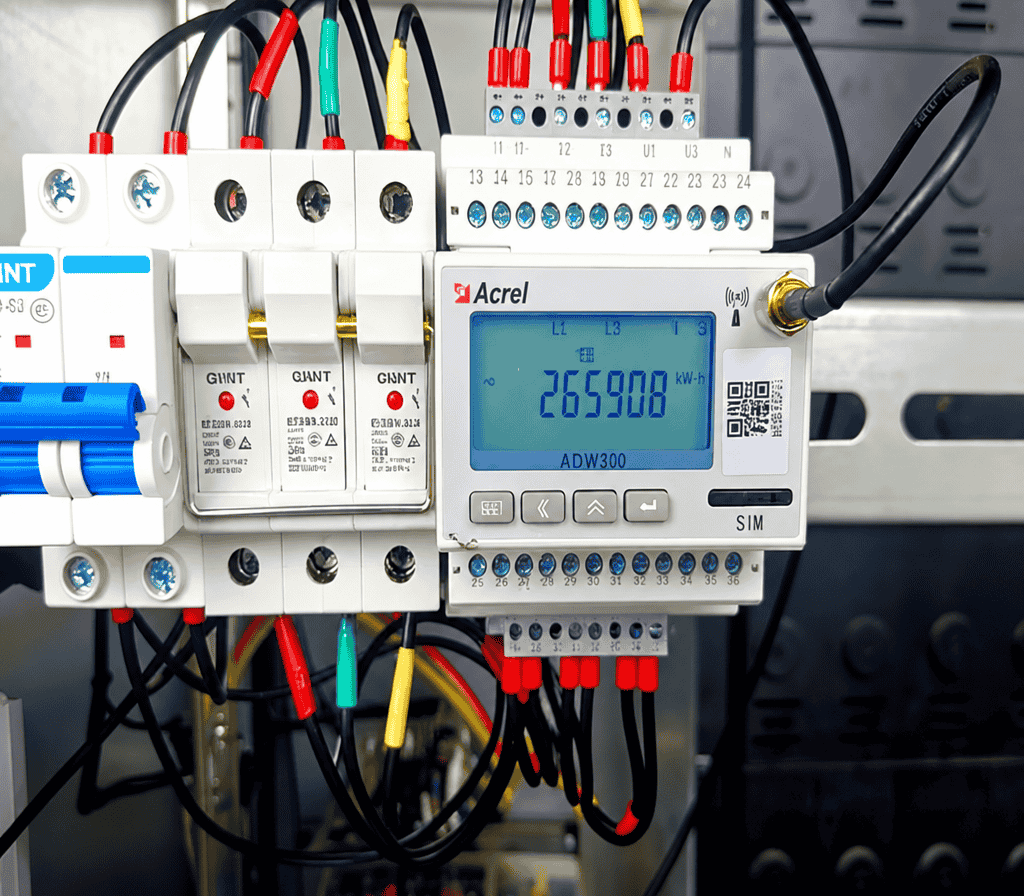
Smart IoT metering
Every plant reports through a smart IoT meter wired straight into its distribution panel — voltage, current, and energy data flowing in over cellular or WiFi, no manual meter reads required.
- Cellular & WiFi connected meters
- Prepaid & postpaid billing modes
- Tamper and offline detection
Real-time system monitoring
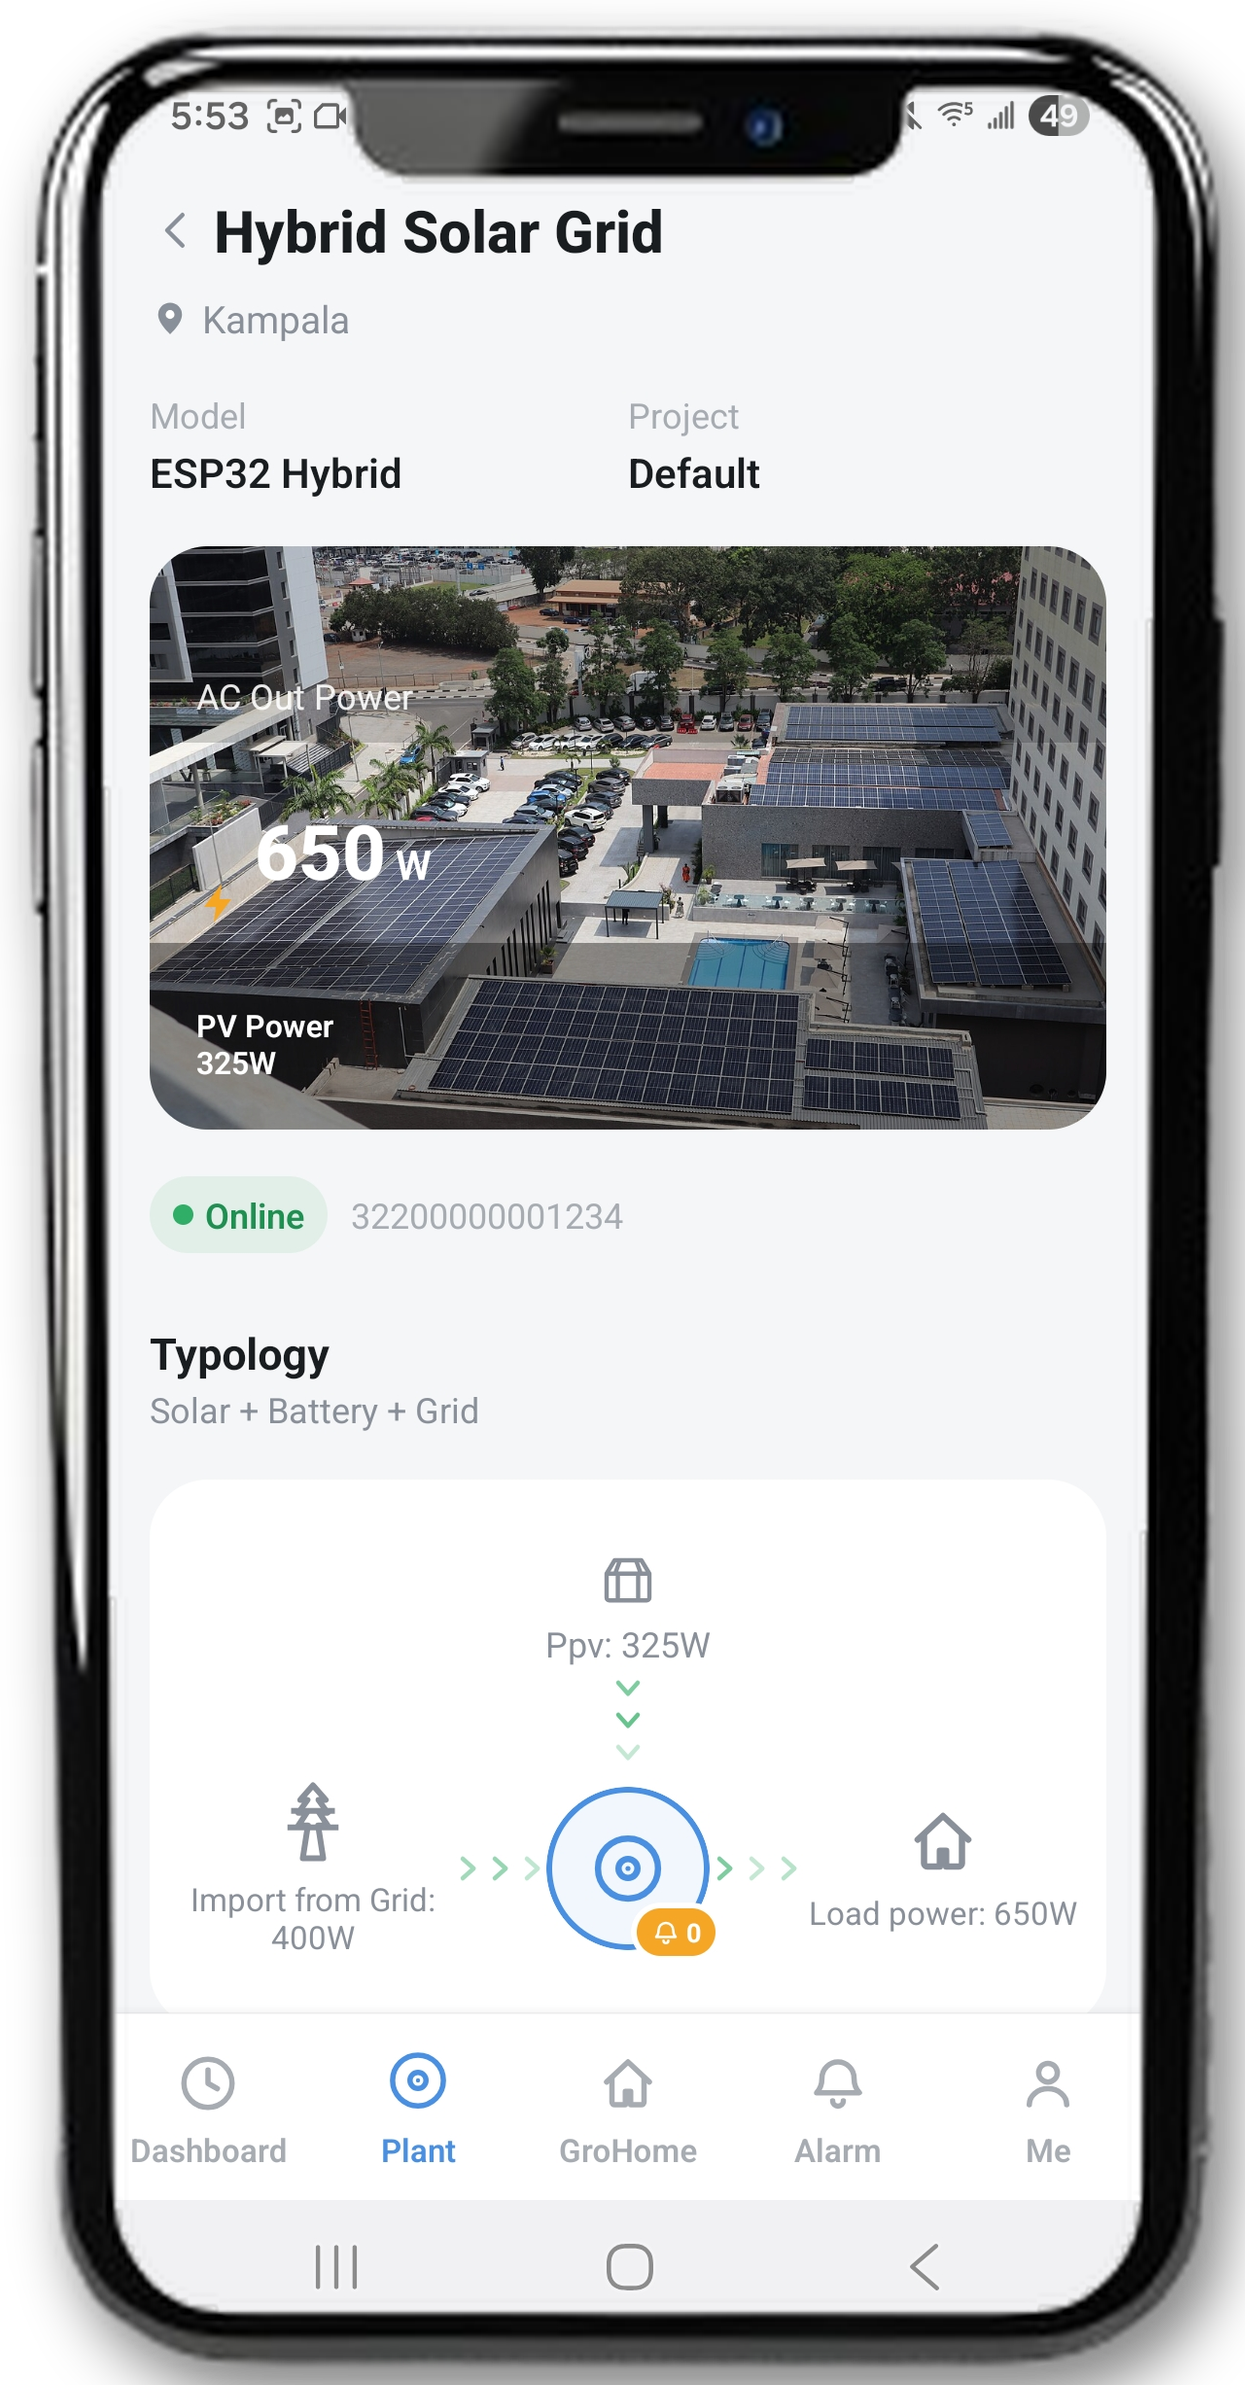
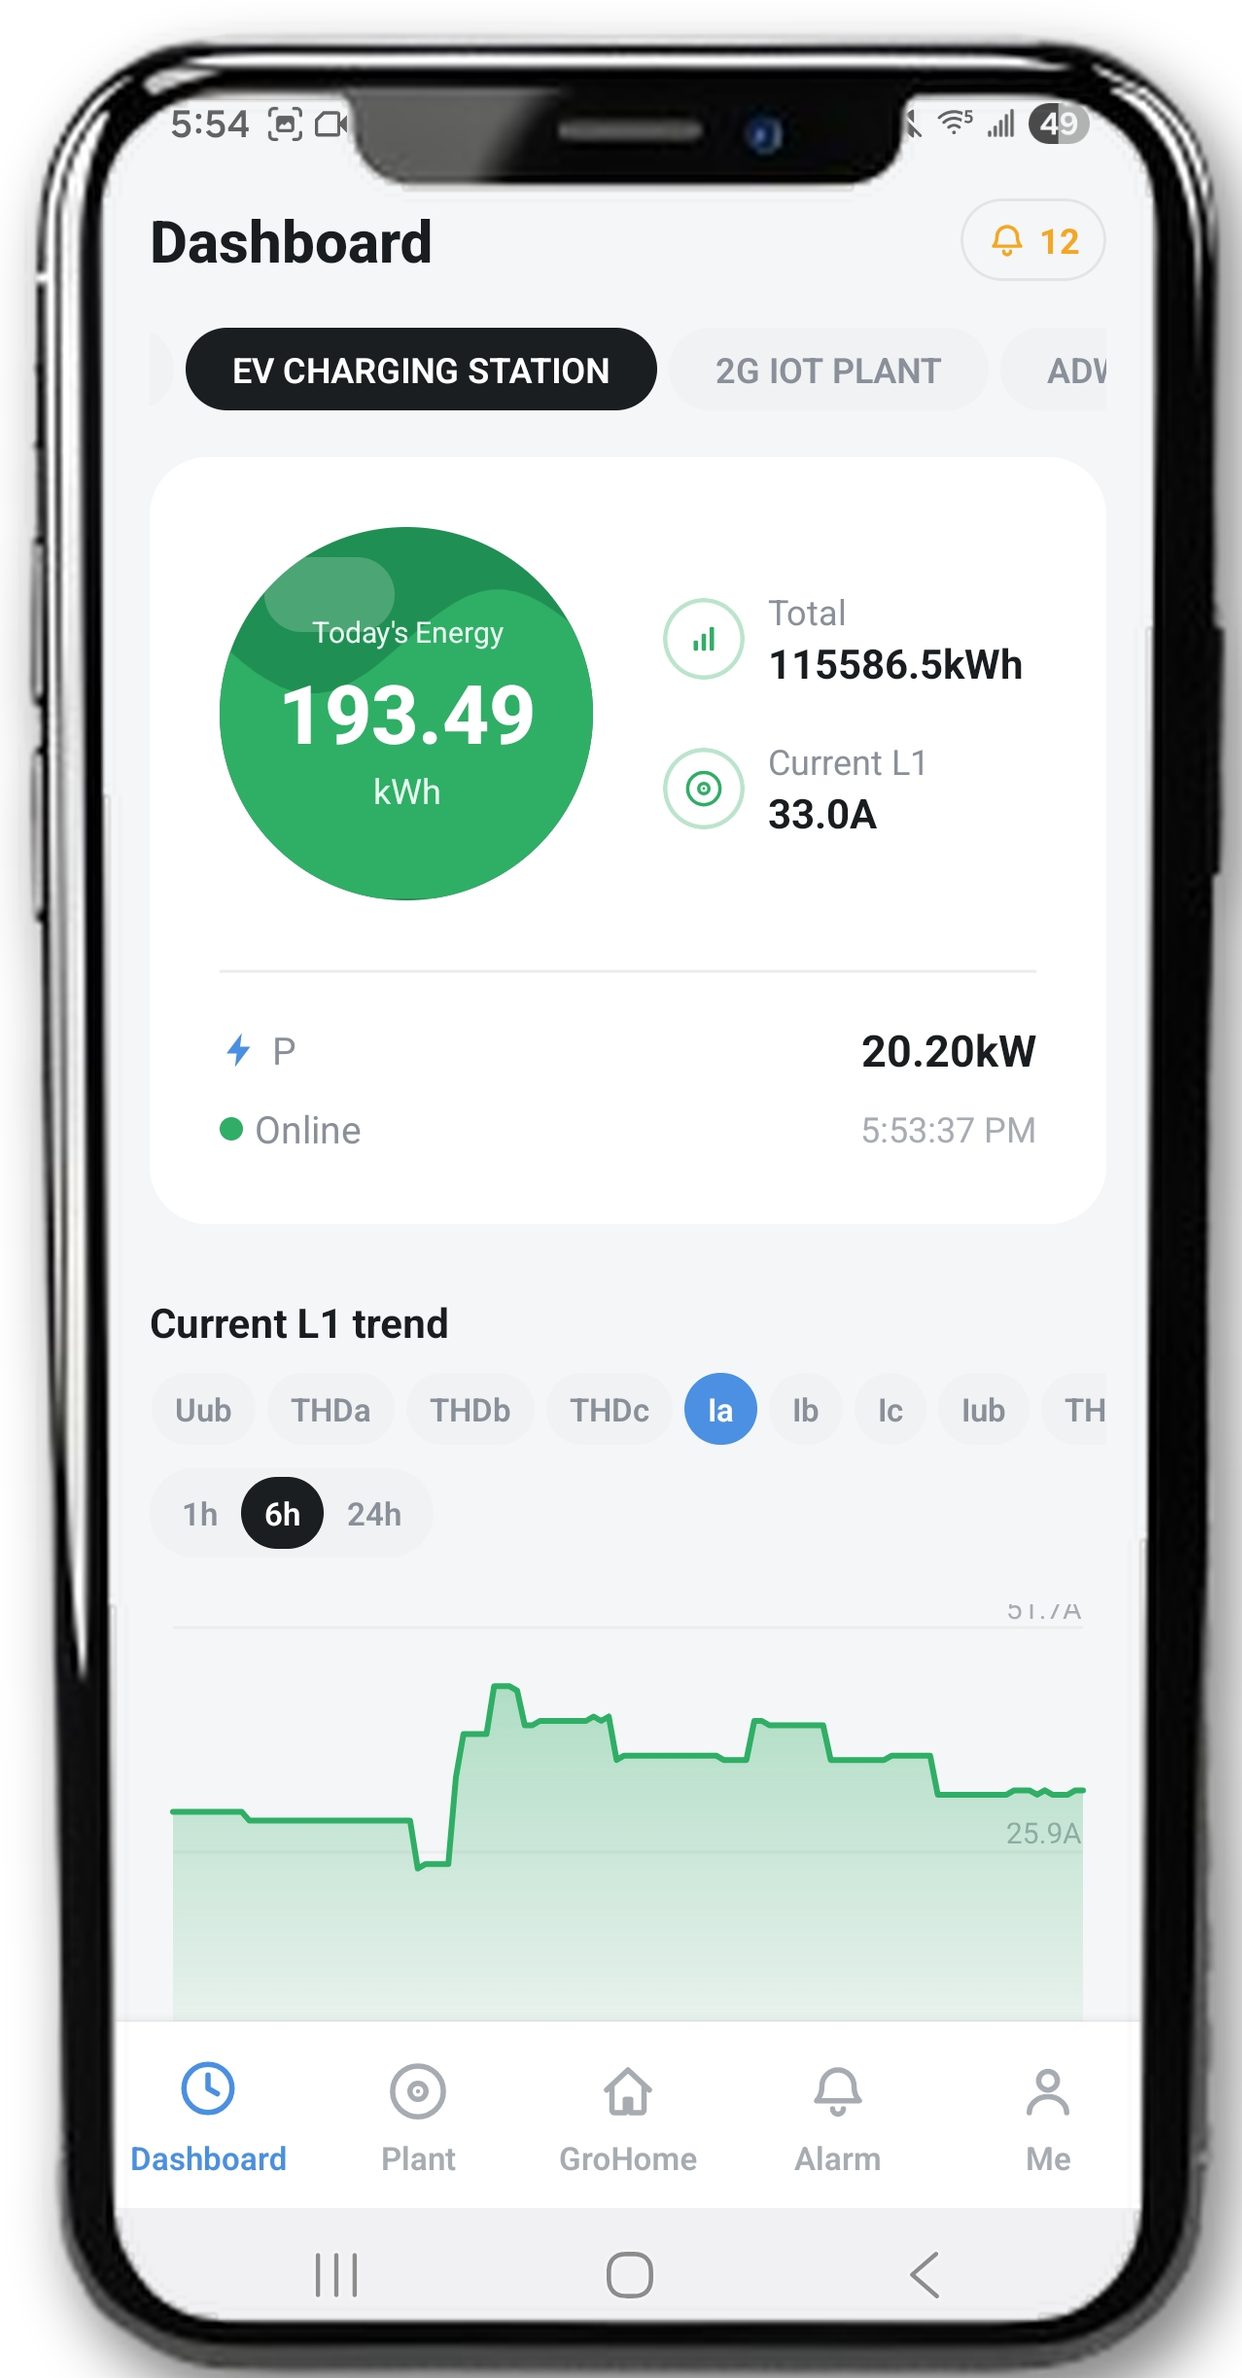
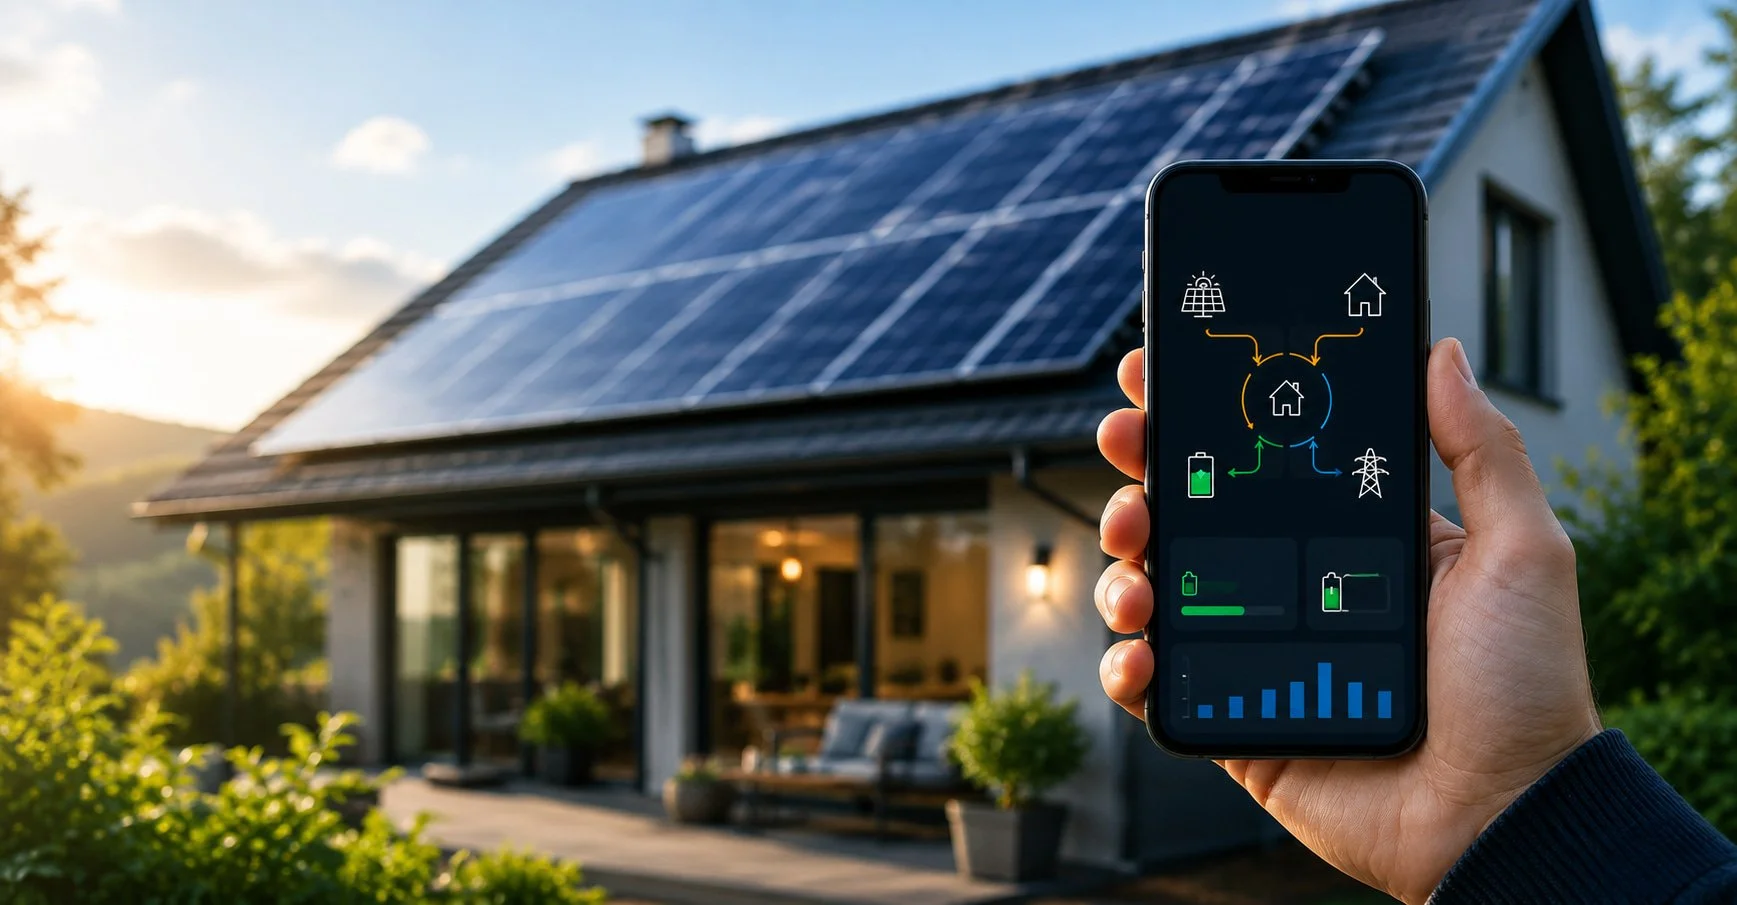
Hybrid solar system performance and live energy flow, right on your phone — generation, consumption, and current trend for every connected plant, wherever you are.
- Live PV generation tracking
- Real-time energy & current trend
- Push alerts the moment something changes
Real-time system monitoring
Hybrid solar system performance and live energy flow, right on your phone — generation, consumption, and current trend for every connected plant, wherever you are.
- Live PV generation tracking
- Real-time energy & current trend
- Push alerts the moment something changes

Demand & carbon
Track demand curves against your generation mix and report carbon offset with the same data you already use to run the plant — no separate spreadsheet required.
- Demand curve tracking
- Carbon offset reporting
- Generation-mix breakdown
Demand & carbon
Track demand curves against your generation mix and report carbon offset with the same data you already use to run the plant — no separate spreadsheet required.
- Demand curve tracking
- Carbon offset reporting
- Generation-mix breakdown
Alarms & alerts
Threshold-based alarms across temperature, quality, and capacity, surfaced on the dashboard the instant a plant needs attention.
- Configurable thresholds
- Flagged tiles across the fleet
- Temperature & capacity coverage